My blog: Alca

  • Teleworking vs presential work CO2e emissions

    In today’s sustainability-driven landscape, understanding the environmental impact of work habits has become more critical than ever. As organizations face increasing pressure to publish their greenhouse gas (GHG) emissions, including Scope 3 categories, it is essential to quantify and compare the carbon footprints of working from home versus working in the office. To address this need, I am developing a Carbon Footprint Calculator designed to empower individuals and organizations to estimate emissions under various work scenarios. This tool will help provide actionable insights, enabling more informed decisions for reducing workplace-related emissions. Here’s a breakdown of how I’m approaching this tool:

    Teleworking: Understanding Energy Consumption

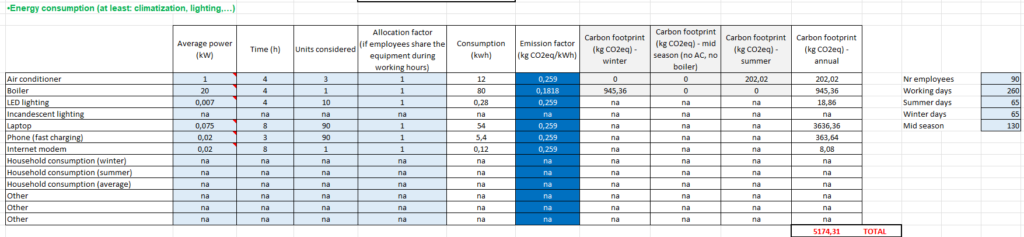
    When working from home, several emission sources are linked to work activities. This includes the energy consumed during the working hours by:

    • Air conditioning (AC)
    • Boilers (for heating)
    • Lighting
    • Electronic devices (e.g., laptops, monitors)

    Exclusions: General household energy consumption for appliances like fridges, washing machines, or dishwashers is omitted.

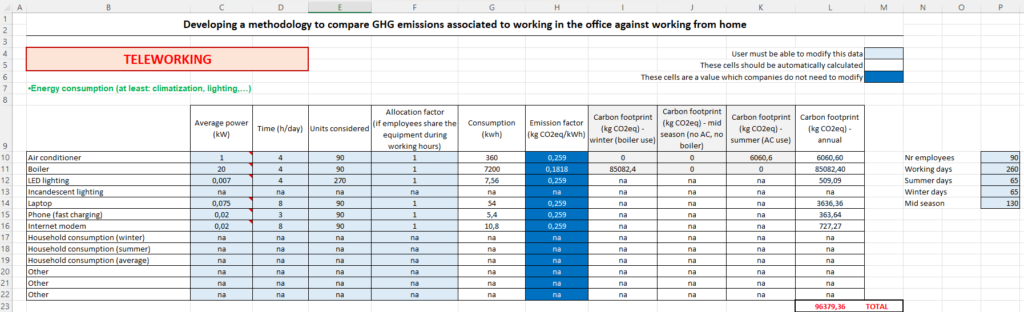
    In the example presented, 90 employees teleworking 260 days a year.

    Calculator Framework

    • Power consumption: Average energy usage for each piece of equipment, sourced from the literature.
    • Hours of use: The number of hours these devices operate during work hours.
    • Number of units: The count of equipment used (e.g., 1 laptop or 2 lights).
    • Allocation factor: Adjusts for shared equipment use (e.g., partners sharing heating or lighting during work hours).

    Key Calculations

    • Energy = Power × Time
    • Emission factors for electricity or natural gas taken from the Oficina Catalana de Canvi Climàtic (OCCC)

    Additional Considerations

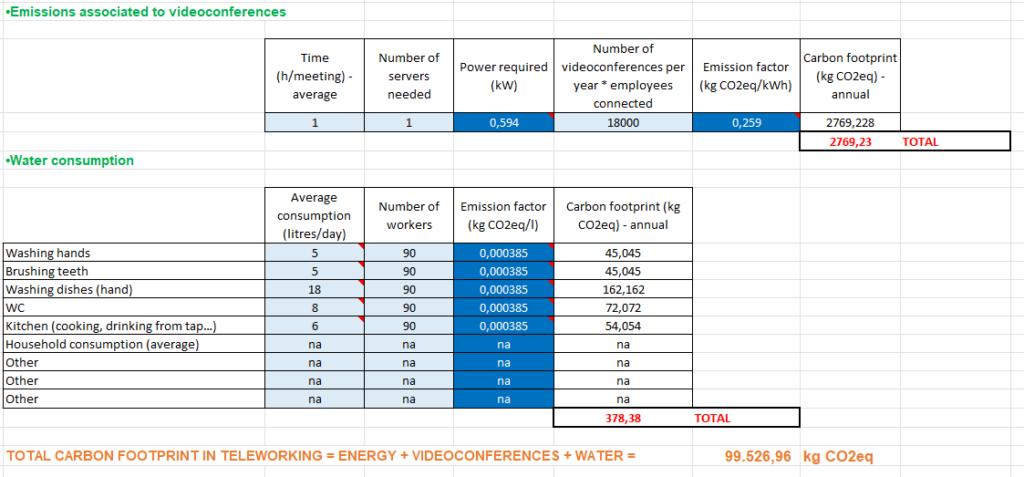
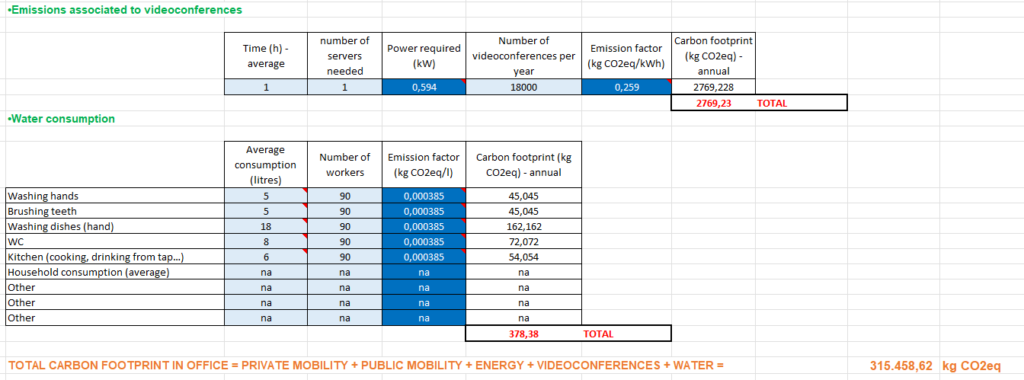
    • Videoconferencing emissions: For online meetings, I will integrate calculations based on the method outlined by Faber, 2021.

    Office Work: Emissions Breakdown

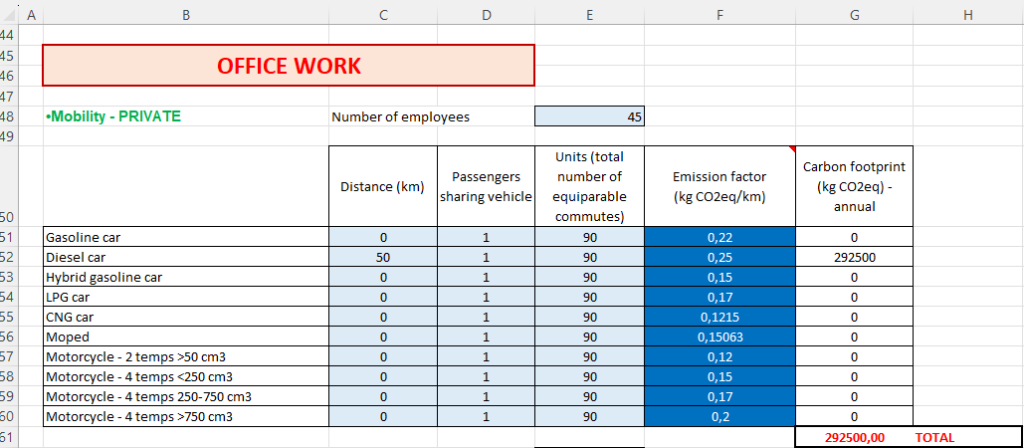
    Mobility – Private Transportation

    • Employees commuting by private vehicles (i.e. 45 employees commuting 50 km with diesel car).
    • Factor in carpooling to adjust emissions per person.
    • Use of known distances and emission factors to calculate total emissions.

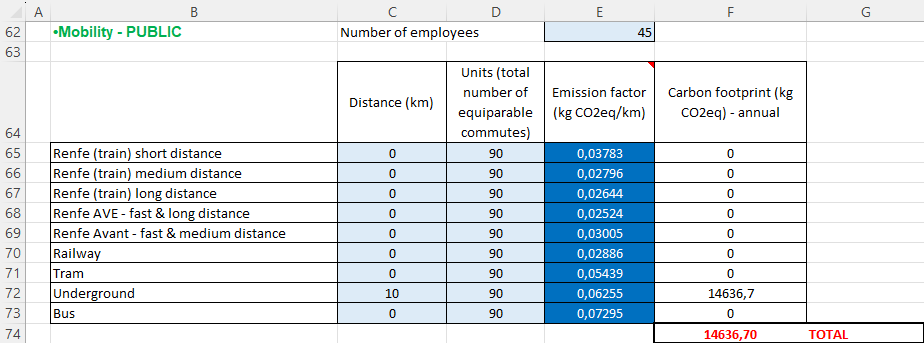
    Mobility – Public Transportation

    • For employees using buses, trains, or other public transit, emissions are estimated using distance and appropriate public transport emission factors according to the OCCC (i.e. 45 employees commuting 10 km by metro).

    Office Energy Consumption

    Energy use in offices often involves shared spaces, reducing the per-person footprint for:

    • Climatization (AC, heating)
    • Lighting
    • Equipment like shared printers or modems.

    Insight: Shared spaces typically reduce energy consumption per person, but is this savings enough to offset mobility emissions? It depends on the commuting habits and distances as well as on the number of people sharing the same space in the office.

    The tool will allow users to:

    1. Calculate emissions for teleworking based on energy consumption and videoconferencing.
    2. Calculate emissions for office work, accounting for both mobility and energy usage.
  • Life Cycle Analysis of Oxalic Acid Production: A Sustainable Future for the Chemical Industry?

    (Feel free to contact me if you are interested in more details)

    As a consultant and researcher, I recently had the opportunity to conduct the first Life Cycle Assessment (LCA) of an oxalic acid industrial production plant. This study aimed to evaluate the environmental impact of oxalic acid production and explore pathways to make it more sustainable. In this blog post, I’ll share the key findings and insights from this detailed analysis.

    Download this document for more details.

    What is Oxalic Acid and Why Does It Matter?

    Oxalic acid is an organic compound with a range of industrial applications, from cleaning and bleaching to being used as a fixative for dyes in fabrics. It also has niche uses in beekeeping as a treatment for varroa mites and in the semiconductor industry for copper polishing. Despite its wide applications, oxalic acid production comes with environmental impacts, primarily due to the resources and energy required.

    This study focuses on evaluating the environmental footprint of producing 1 kg of oxalic acid and exploring potential improvements.

    The Environmental Footprint of Oxalic Acid Production

    The study assessed the environmental impacts from a cradle-to-gate perspective, meaning from raw material extraction to the point where the product leaves the factory. One of the key findings was that electricity consumption plays the largest role in several critical impact categories, including climate change, freshwater ecotoxicity, and fossil resource depletion.

    Here’s a snapshot of the carbon footprint results for producing 1 kg of oxalic acid, which is influenced by the energy source used in production:

    • Climate Change Impact: Between 0.53 and 0.57 kg CO2eq depending on the allocation method.

    Electricity and Sugar: The Major Environmental Hotspots

    The LCA revealed two key processes that contribute the most to the environmental impacts:

    1. Electricity consumption: This was the biggest contributor to climate change and fossil resource depletion.
    2. Sugar production: Sugar, used as a raw material in the process, significantly impacts the land use category due to agricultural practices.

    The study explored different green energy scenarios to assess how a shift to renewable energy sources could reduce the environmental impact of oxalic acid production. Even a small shift to 20% green electricity showed significant reductions in the overall carbon footprint, suggesting that renewable energy could be a game changer for this industry.

    In addition, logistics and transport also play a role in the overall footprint, with raw materials being transported long distances. A shift to more local sourcing could further decrease the environmental burden.

    Conclusions: A Path Towards Greener Oxalic Acid Production

    This LCA highlights the importance of green electricity in reducing the environmental impacts of oxalic acid production. While challenges remain—particularly in reducing the land use impact of sugar production—there is a clear path forward through energy transitions. By implementing the recommendations from this study, the producer significantly reduced its environmental footprint and contribute to a more sustainable chemical industry.

  • Green Hydrogen: Paving the Way for a Sustainable Future in the Canary Islands

    (Feel free to contact me if you are interested in more details)

    During my time working with the UNESCO Chair in Life Cycle and Climate Change, I had the privilege of serving as a consultant for Disa and Enagas on a groundbreaking project: the development of a green hydrogen production plant in the Canary Islands. As part of this effort, I conducted a comprehensive carbon footprint study comparing the impact of this proposed green hydrogen system to the current fossil fuel-dependent model. Green hydrogen must be the energy vector of the future, according to several communications from the European Commission.

    In this blog, I’ll share the key insights from my study, which highlight the potential of green hydrogen to significantly reduce the region’s greenhouse gas emissions.

    Download this document for more details.

    A Region Rich in Renewable Resources

    The Canary Islands are uniquely positioned to leverage renewable energy sources like wind and solar power, making them an ideal location for green hydrogen production. Hydrogen is produced through electrolysis, using renewable electricity and desalinated seawater—an environmentally friendly alternative to fossil fuels.

    The goal of this project is to help the Canary Islands transition away from diesel/gasoline, liquefied natural gas (LNG), and propane air, which are currently the primary fuels used for critical activities such as terrestrial transport, hotel energy consumption, and industrial processes. My study analyzed the carbon footprint of this transition and the potential impact of adopting green hydrogen across three stages of implementation. The emission factors published by the Ministry for Ecological Transition and the Demographic Challenge of the Spanish Government have been used for this calculation.

    Key Findings: A Comparison of Carbon Footprints

    In the study, I compared the current system, which is heavily reliant on fossil fuels, with the proposed green hydrogen scenario. The following table summarizes the carbon footprints of each scenario across the three stages of implementation:

    ProcessStage 1 (ton CO2eq)Stage 2 (ton CO2eq)Stage 3 (ton CO2eq)
    Future system (green hydrogen)121184518
    Current system (fossil fuels)68881137426820
    Decarbonization67671119026302

    The results clearly demonstrate that the green hydrogen system can drastically reduce CO2 emissions. In the current system, emissions are primarily driven by diesel production and use, as well as emissions from LNG and propane air. In comparison, the future hydrogen-based system’s emissions are mainly due to the logistics of transporting hydrogen—a process that is currently less efficient than transporting diesel.

    Challenges and Recommendations

    While the carbon footprint analysis shows the significant environmental benefits of adopting green hydrogen, the logistics of transporting hydrogen remain a challenge. Transporting hydrogen requires 16.49 times more trucks than transporting diesel for the same amount of energy. As a result, I recommended further research into alternatives such as using carriers (i.e. ammonia), liquefied hydrogen or the use of pipelines to enhance transport efficiency and further reduce emissions.

    Additionally, my analysis focused on carbon footprint reduction, but I believe a broader assessment of other environmental impacts—such as Cumulative Energy Demand (CED), Land Use (LU), and Water Use (WU)—is necessary to get a full picture of the project’s sustainability.

    Conclusion: A Path Towards Decarbonization

    As a consultant on this project for Disa and Enagas, I found that the shift from fossil fuels to a green hydrogen-based energy system offers enormous potential for reducing the carbon footprint of the Canary Islands. With an estimated 26,302 tons of CO2 avoided annually, the benefits of this transition are clear.

    However, improving the logistics of hydrogen transport will be key to maximizing the environmental benefits of this project. With the right infrastructure and innovative solutions, I’m confident that the Canary Islands can become a leader in renewable hydrogen production, setting an example for other regions aiming to decarbonize their energy systems.

  • COP27: A Turning Point or Business as Usual? My Personal Experience and Reflections

    COP27: A Turning Point or Business as Usual? My Personal Experience and Reflections

    As the world gathered for COP27, dubbed the “Implementation COP,” the focus was clear: moving from promises to tangible actions. Held in Sharm El-Sheikh, Egypt, this conference represented a crucial moment for the global fight against climate change. In this blog, I’ll share my reflections on the outcomes of COP27, how it compared to previous COPs, and the ever-pressing dilemma of reducing carbon footprints.

    For a broader perspective on what was my experience there, I encourage you to check out these articles:

    The Outcomes of COP27: Successes and Shortcomings

    One of the most notable achievements of COP27 was the agreement to establish a loss and damage fund. This is a significant step for vulnerable countries disproportionately affected by climate change. However, many questions remain: who will contribute to the fund, and how much will be allocated? Countries like China, Qatar, and Saudi Arabia fall into a grey area—are they considered developing or should they pay?

    Despite this progress, COP27 failed to make notable advancements in its implementation program to cut emissions faster. There was limited progress on ensuring that emissions peak by 2025, which is essential if we are to limit global temperature rise to 1.5ºC. Compared to COP26 in Glasgow, the language used regarding coal phase-outs was stricter, but it still lacked the urgency many had hoped for.

    My Personal Reflections: Lessons from the Ground

    Participating in COP27 was a fascinating experience. The event highlighted how the world comes together in the name of a common good but often gets entangled in self-interest. From the early hours of closed-door negotiations to the public-facing discussions, there was a palpable tension between what’s good for the planet and what’s advantageous for individual countries. The sheer division of priorities across nations was evident.

    Moreover, aother debated aspect of any COP event is the carbon footprint to bring everybody to such a massive event. Thousand of delegates, representatives, and participants. It’s a bit of a paradox—flying to climate summits while aiming to reduce emissions. In this section, I’ll dive into a comparison of the carbon footprints of COP25, COP26, and COP27, analyzing the impact of travel and other factors that contributed to the emissions of each conference. By looking at the numbers, we can better understand how the logistics of these events evolve and what changes might be necessary moving forward.

    A Carbon Footprint Analysis: Comparing COP25, COP26, and COP27

    (Please, feel free to contact me in the case you wish to see more details about the calculation procedure)

    I will start first by defining where these COPs were held and how many people did they gather:

    COP editionCOP25COP26COP27
    LocationMadrid (Spain)Glasgow (UK)Sharm El-Sheikh (Egypt)
    Participants26,700.00 (published)40,000.00 (published)35,000.00 (published)
    (Source: United Nations)

    CNBC, published in 2021 a study reporting the carbon footprints of the COP26 and COP25, providing the distribution of the carbon footprint from COP26 between International flights and accomodation. Taking this study as a reference I have been able to estimate the carbon footprint impacts in COP27.

    COP editionCOP-25COP-26COP-27
    Tons of CO2 emitted51,101.00 (published)102,500.00 (published)67,812.50 (calculation)
    International flights60% (I assume same as COP-26)60% (published)60% (I assume same as COP-26 and directly proportional to number of participants*)
    Accomodation40% (I assume same as COP-26)40% (published)40% (I assume same as COP-26 and directly proportional to number of participants**)
    *Probably even more flights are needed to reach Sharm El-Sheikh than Glasgow or Madrid
    **This value is being corrected in next tables according to the energy efficiency of each country
    (Source: CNBC)

    The estimate for accomodation was corrected to take into consideration the differences in the energy efficiency of each country according to ACEEE.

    COP editionCOP25COP26COP27
    LocationMadrid (Spain)Glasgow (UK)Sharm el-Shiekh (Egypt)
    Country energy eff.0.6600.7250.315
    (Source: ACEEE)

    After this slight correction, the carbon footprints were recalculated obtaining next results:

    COP editionCOP-25COP-26COP-27
    Tons of CO2 emitted75698.48102500.00148177.58
    International flights30660.6061500.0053812.50
    Accomodation45037.8841000.0094365.08

    Finally, results per participant were provided:

    COP editionCOP-25COP-26COP-27
    Tons of CO2 pp2.842.564.23
    Intern. flights pp1.151.541.54
    Accomodation pp1.691.032.70

    Notably, while COP27 had fewer participants than COP26, it had a higher carbon footprint per person. Is it to say that the logistical challenges of hosting in a more remote location like Sharm El-Sheikh, which likely required more flights and different accommodation needs was not even considered.

    Energy efficiency in different countries also played a role; Egypt’s energy score, according to the ACEEE international scorecard, was 0.315, significantly lower than that of the UK or Spain.

    Final Thoughts: The Climate Change Dilemma

    As we look forward to future COP events, it’s clear that addressing climate change isn’t just about cutting emissions—it’s also about tackling deep-rooted issues of equity and fairness. Who pays for the damage? Who benefits from climate finance? And how do we ensure that developed and developing nations work together in a way that’s equitable and effective?

    COP27 has reminded us that while progress is possible, it’s often slow and uneven. The path forward requires global collaboration, but it also demands that we hold nations accountable for their commitments.

  • Why Advanced LCA is Critical for a Sustainable Future

    As the world grapples with climate change and environmental degradation, the role of businesses in driving sustainable change has never been more important. But how can companies truly understand and reduce their environmental impact? The answer lies in Life Cycle Assessment (LCA), a powerful tool that allows organizations to measure and manage the sustainability of their products and processes from start to finish.

    Alca is a resilient seabird found in the cold, coastal regions of the Northern Hemisphere. The Alca now faces immense challenges due to climate change, with rising sea levels and warming oceans threatening its survival. This bird’s plight mirrors the struggles many industries face in navigating an increasingly uncertain environmental landscape. Inspired by the Alca’s story, this blog is dedicated to exploring how businesses can adapt to these challenges and thrive through sustainable practices.


    What is Life Cycle Assessment (LCA)?

    LCA is a methodology used to assess the environmental impact of a product, service, or process across its entire lifecycle—from raw material extraction to production, distribution, use, and disposal. Unlike traditional environmental assessments that focus on a single stage or aspect of a product, LCA provides a comprehensive, 360-degree view, making it an indispensable tool for sustainability-focused companies.

    Through LCA, businesses can identify the most environmentally harmful aspects of their operations and find opportunities to reduce waste, emissions, and resource use. This not only helps to improve their environmental footprint but also drives innovation and efficiency, leading to long-term financial benefits.

    The Importance of Business Strategy in Climate Action

    Sustainability is no longer just a buzzword—it’s a business imperative. With increasing regulatory pressures, consumer demands for transparency, and the clear financial risks of inaction, companies must integrate sustainability into their core strategies. This is where LCA comes in.

    By using LCA, businesses can make informed decisions about product design, supply chain management, and resource allocation. It helps them stay ahead of regulations, improve brand reputation, and create products that are truly sustainable, not just greenwashed.

    Real-world case studies show how leading companies have used LCA to drive innovation, reduce costs, and lead the way in their respective industries. These examples serve as a blueprint for others looking to make a positive impact while ensuring long-term viability.

    Why This Blog Matters

    This blog will serve as a resource for businesses and professionals who want to make informed, impactful decisions when it comes to sustainability. Here, you’ll find real-world case studies, updates on the latest regulations, and insights into how LCA can help your company navigate the complexities of climate action.

    From breaking down new sustainability laws to providing practical tips on improving product lifecycles, this blog will be your guide to creating lasting, meaningful change.